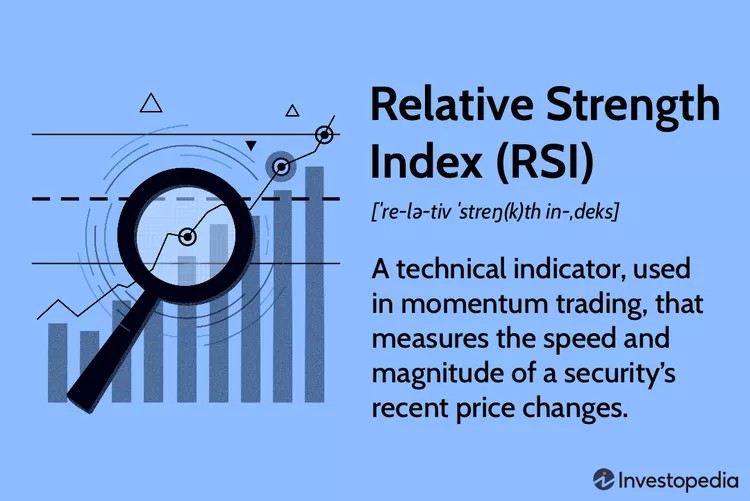
RSI measures momentum to identify overbought (above 70) or oversold (below 30) conditions. Advanced traders use RSI with divergence signals to time entries and exits.
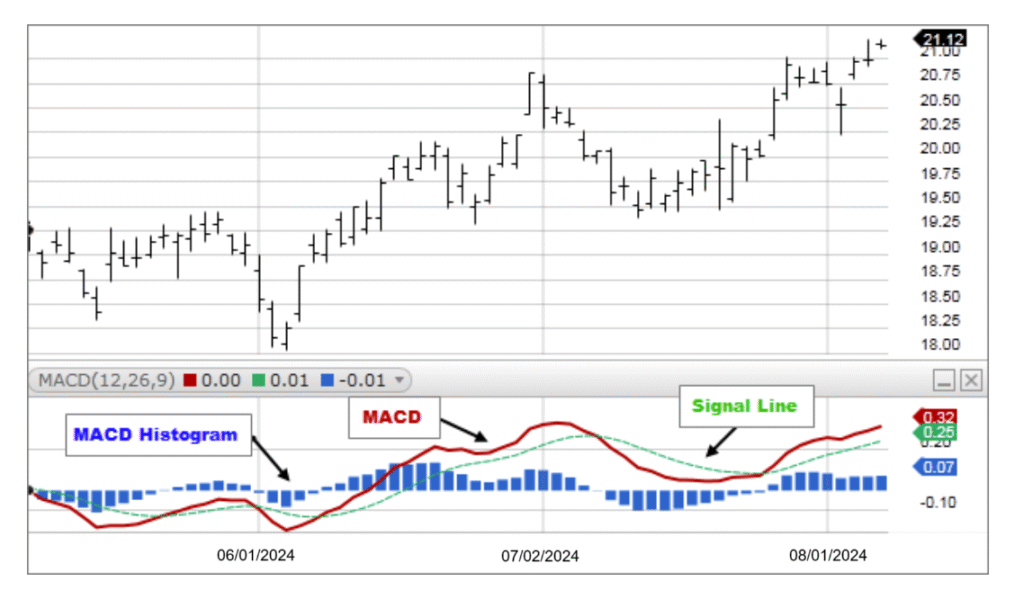
MACD tracks trend strength and direction using the difference between two exponential moving averages (EMAs). Advanced traders use MACD crossovers with signal line and histogram analysis.
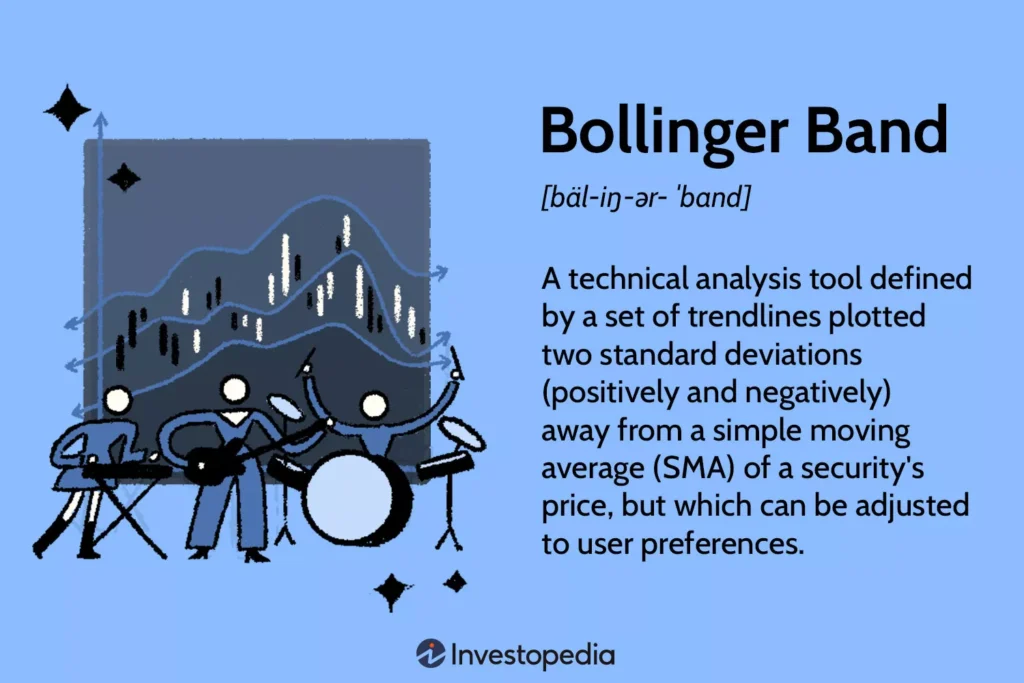
Bollinger Bands measure volatility using a 20-day SMA with upper/lower bands set at 2 standard deviations. Advanced traders use them for mean-reversion and breakout strategies.
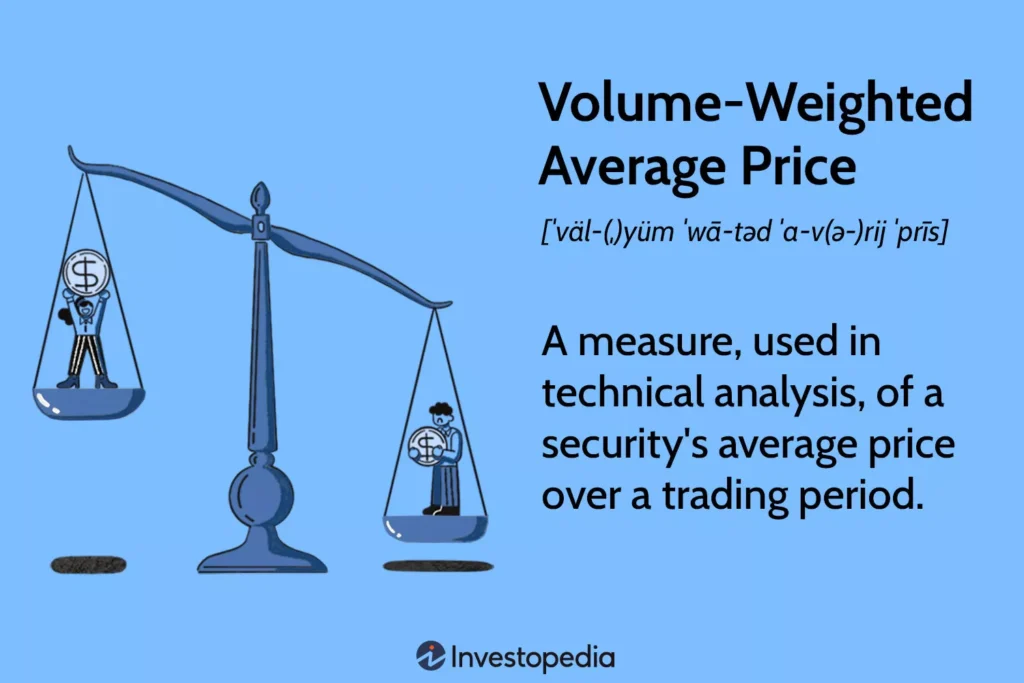
VWAP calculates the average price weighted by volume, serving as a benchmark for intraday trading. Advanced traders use VWAP to gauge value zones and momentum.
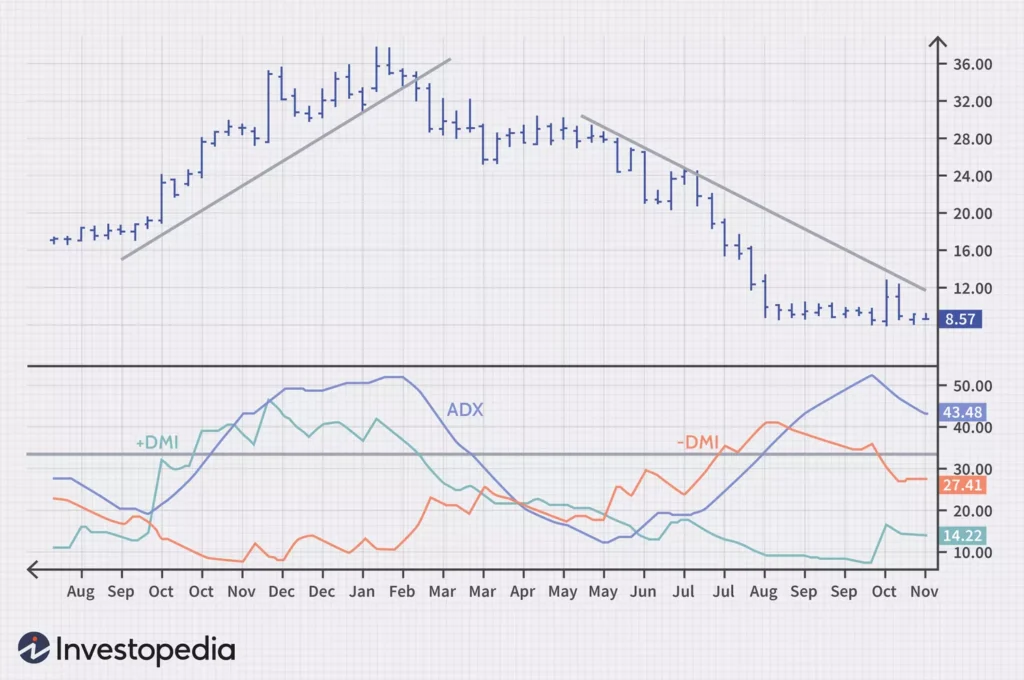
ADX measures trend strength (0-100 scale). Advanced traders use ADX above 25 to confirm trending markets and below 20 for range-bound strategies.
Options Trading: Volatility Strategies
Learn to leverage implied volatility using straddles and strangles. This guide covers setting up trades during earnings seasons and managing risk with delta-neutral positions.
- Straddle Example: Buy a call and put at the same strike price to profit from large price swings.
- Risk Management: Limit losses with stop-loss orders based on historical volatility (e.g., 20% below entry).
Statistical Arbitrage
Use statistical models to exploit price discrepancies between correlated assets. Requires proficiency in Python or R for modeling.
Case Study: Golden Cross in Apple Stock (2024)
In Q3 2024, Apple’s 50-day SMA crossed above its 200-day SMA, signaling a bullish trend. Traders entered long positions at $220, with a target of $250 based on historical resistance. The chart below illustrates this setup.

Outcome: Price reached $245 in 8 weeks, yielding a 11.4% return for disciplined traders.
-
- “Stock Market Trend Prediction Using Deep Neural Networks” (2025): Examines limitations of LSTM and DNN models for price prediction, proposing trend-based models instead. Read Paper
[](https://www.nature.com/articles/s41599-025-04761-8)
-
- “Competition and Learning in Dealer Markets” (2024): Analyzes limit order book dynamics for option pricing and risk management. Read Summary
[](https://www.globaltrading.net/research-on-the-web-in-2024/)
Curated insights from trading experts on X, focusing on advanced strategies (June 2025):
- @TraderLion: “Mastering high-frequency trading requires understanding order book dynamics. Use LOB data to anticipate price moves.” View Post
- @OlegTkachenko: “Combine EMAs with RSI to confirm Golden Cross signals. Discipline is key in volatile markets.” View Post
Note: Links are placeholders.
-
- BlackRock Investment Institute Weekly Commentary (June 2025): Discusses policy uncertainty and tariff impacts on market volatility. Read Report
[](https://www.blackrock.com/us/individual/insights/blackrock-investment-institute/weekly-commentary)
-
- FOREX.com Market Analysis (June 2025): Provides insights on forex trends and trading opportunities. Read Analysis
[](https://www.forex.com/en-uk/news-and-analysis/)
